You have skipped the navigation, tab for page content


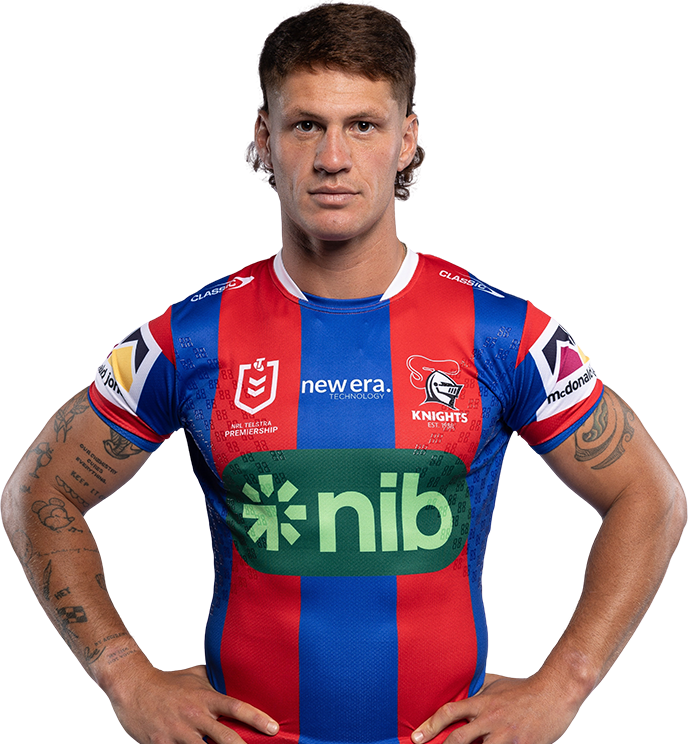
Kalyn Ponga
Captain - Fullback
Player Bio
- Height:
- 184 cm
- Date of Birth:
- 30 March 1998
- Weight:
- 92 kg
- Birthplace:
- , Australia
- Age:
- 27
- Nickname:
- KP
- Debut Club:
- North Queensland Cowboys
- Date:
- 16 September 2016
- Opposition:
- Brisbane Broncos
- Round:
- 28
- Previous Club:
- North Queensland Cowboys
- Junior Club:
- Souths Mackay, Easts Tigers Brisbane
- Biography:
Knight #296
Since arriving at the Knights in 2018 as a teenager, Kalyn Ponga has evolved into one of the league's premier game-breakers.
A Mackay junior, KP made his NRL debut for the North Queensland Cowboys in 2016 before arriving in Newcastle, going onto almost win the Dally M Medal in his first season in red and blue.
The skilful fullback has spent seven seasons in the red and blue which included claiming a maiden Dally M Medal for a memorable and inspiring 2023 campaign.
A Queensland Origin representative and Captain of the Club, KP is signed on until at least the end of the 2027 season.
Career By Season
| Year | Played | Won | Lost | Drawn | Win % | Tries | Goals | 1 Point Field Goals | 2 Point Field Goals | Points | Kicking Metres | Kicking Metres Average | Goal Conversion Rate | Forced Drop Outs | Try Assists | Linebreaks | Receipts | Tackles Made | Missed Tackles | Tackle Efficiency | Total Running Metres | Average Running Metres | Kick Return Metres | Total Points | Average Points | |
|---|---|---|---|---|---|---|---|---|---|---|---|---|---|---|---|---|---|---|---|---|---|---|---|---|---|---|
| Cowboys | 2016 | 2 | 1 | 1 | - | 50% | - | - | - | - | - | - | - | - | - | - | 1 | 28 | 4 | 1 | 75.00% | 236 | 118.00 | 27 | 46 | 23.0 |
| Cowboys | 2017 | 7 | 2 | 5 | - | 29% | 3 | - | - | - | 12 | 50 | 7.14 | - | - | - | 8 | 153 | 19 | 8 | 70.37% | 879 | 125.00 | 413 | 287 | 41.0 |
| Knights | 2018 | 20 | 7 | 13 | - | 35% | 6 | 27 | - | - | 78 | 1,295 | 64.77 | 69.23% | 7 | 11 | 12 | 698 | 105 | 42 | 71.43% | 2,855 | 142.00 | 990 | 1,037 | 51.8 |
| Knights | 2019 | 20 | 8 | 12 | - | 40% | 11 | 48 | - | - | 140 | 1,117 | 55.83 | 80.00% | 8 | 9 | 15 | 718 | 113 | 42 | 72.90% | 2,557 | 127.00 | 788 | 977 | 48.8 |
| Knights | 2020 | 19 | 11 | 8 | - | 58% | 10 | 46 | - | - | 132 | 1,598 | 84.11 | 65.71% | 8 | 14 | 12 | 791 | 54 | 41 | 56.84% | 3,502 | 184.00 | 1,064 | 1,106 | 58.2 |
| Knights | 2021 | 15 | 8 | 7 | - | 53% | 8 | 10 | - | - | 52 | 334 | 22.23 | 71.43% | 1 | 14 | 9 | 584 | 45 | 29 | 60.81% | 2,178 | 145.00 | 548 | 743 | 49.5 |
| Knights | 2022 | 14 | 3 | 11 | - | 21% | 4 | 12 | - | - | 40 | 343 | 24.51 | 80.00% | 2 | 6 | 6 | 455 | 45 | 15 | 75.00% | 1,794 | 128.00 | 601 | 509 | 36.4 |
| Knights | 2023 | 20 | 12 | 8 | - | 60% | 9 | 46 | - | - | 128 | 2,136 | 106.80 | 76.67% | 5 | 21 | 19 | 647 | 121 | 50 | 70.76% | 2,903 | 145.00 | 700 | 1,016 | 50.8 |
| Knights | 2024 | 16 | 7 | 9 | - | 44% | 3 | 46 | - | - | 104 | 1,732 | 108.24 | 85.19% | 5 | 11 | 17 | 622 | 54 | 25 | 68.35% | 2,741 | 171.00 | 948 | 878 | 54.9 |
| Knights | 2025 | 13 | 5 | 8 | - | 38% | 1 | 19 | - | - | 42 | 1,594 | 122.65 | 76.00% | 6 | 9 | 4 | 565 | 49 | 28 | 63.64% | 2,113 | 162.00 | 664 | 543 | 41.8 |


