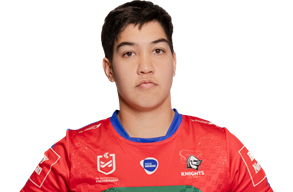
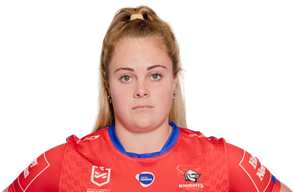
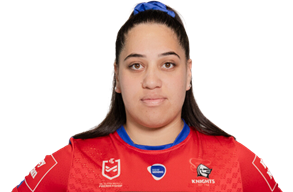
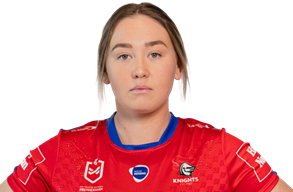
You have skipped the navigation, tab for page content


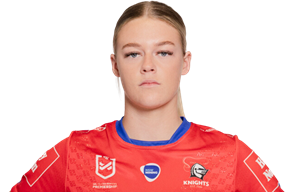
Hannah Southwell
Captain - Lock
Player Bio
- Height:
- 172 cm
- Date of Birth:
- 04 March 1999
- Weight:
- 75 kg
- Birthplace:
- Newcastle, NSW
- Age:
- 25
- Nickname:
- Han
- Debut Club:
- St. George Illawarra Dragons Women
- Date:
- 09 September 2018
- Opposition:
- Brisbane Broncos Women
- Round:
- 1
- Previous Clubs:
- St. George Illawarra Dragons Women, Sydney Roosters Women
- Junior Club:
- Kotara Bears
- Biography:
Knight #29
Premiership-winning Captain and proud Novocastrian, Hannah Southwell provides leadership and strength in the middle of the field.
The NSW representative and Jillaroo – one of an elite group of athletes to have represented Australia in three different sports – started her NRLW career with the St George Illawarra Dragons before three seasons at the Roosters.
Southwell joined the Knights in 2022, while made her recovery from a long-term knee injury in 2023 to help steer the Club to back-to-back premierships.
A natural leader and Kotara Bears junior, Southwell along with her sister Jesse have inked deals that include terms that date through to the end of 2027.
Career By Season
| Year | Played | Won | Lost | Drawn | Win % | Tries | Goals | 1 Point Field Goals | 2 Point Field Goals | Points | Kicking Metres | Kicking Metres Average | Goal Conversion Rate | Tackle Breaks | Post Contact Metres | Offloads | Tackles Made | Missed Tackles | Tackle Efficiency | Total Running Metres | Average Running Metres | Kick Return Metres | Total Points | Average Points | |
|---|---|---|---|---|---|---|---|---|---|---|---|---|---|---|---|---|---|---|---|---|---|---|---|---|---|
| Dragons | 2018 | 3 | 1 | 2 | - | 33% | - | - | - | - | - | - | - | - | 9 | 91 | 2 | 33 | 4 | 86.73% | 285 | 95.00 | - | 92 | 30.7 |
| Roosters | 2019 | 3 | - | 3 | - | - | - | - | - | - | - | - | - | - | 4 | 27 | 2 | 59 | 3 | 91.93% | 116 | 38.00 | 12 | 78 | 26.0 |
| Roosters | 2020 | 3 | 2 | 1 | - | 67% | - | - | - | - | - | - | - | - | 5 | 127 | 2 | 59 | 7 | 84.93% | 275 | 91.00 | 3 | 89 | 29.7 |
| Roosters | 2021 | 7 | 4 | 3 | - | 57% | - | 3 | - | - | 6 | 49 | 7.04 | 37.50% | 13 | 254 | 1 | 142 | 12 | 92.21% | 611 | 87.00 | 8 | 217 | 31.0 |
| Knights | 2022 | 1 | 1 | - | - | 100% | - | - | - | - | - | - | - | - | 2 | 30 | - | 16 | 1 | 94.12% | 67 | 67.00 | - | 20 | 20.0 |
| Knights | 2023 | 8 | 8 | - | - | 100% | 1 | - | - | - | 4 | - | - | - | 2 | 98 | - | 185 | 12 | 93.91% | 342 | 42.00 | - | 202 | 25.2 |
